Technical Analysis
Technical Analysis XRP/USD 06/09/2017

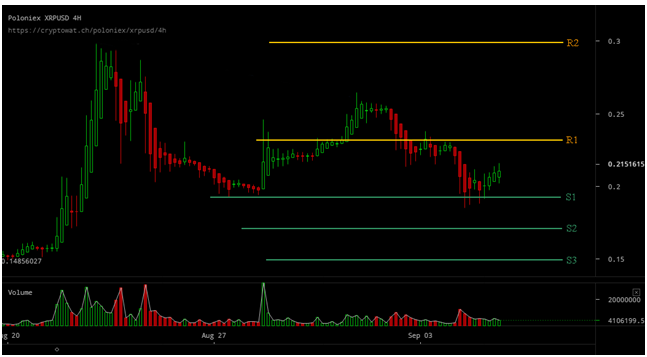
The downward movement from the XRP / USD parity stopped at 0.185usd. This movement temporarily broke S1 $0.19 USD, after which the price went up slightly. XRP / USD stayed in sync with the BTC move. The return movement is identical to that on the BTC.
Yesterday I posted a quick update on our Twitter page, which said that the next support area on the BTC is at $3900 usd. Here’s how the BTC has reached that price and then has a comeback. On the 4-hours XRP / USD chart, we have a buy signal given by the MACD indicator. I would be quite cautious about this signal. At the time we write the analysis (hour 0) we do not have a clear signal from the BTC that the correction would have ended.
The resistance lines are: The support lines are:
R1 – 0,23usd S1 – 0,19usd
R2 – 0.30usd S2 – 0,175usd
S3 – 0,15usd
Probable direction for the next two days:
The XRP / USD moves will be top-down, characterized by the price quest to find a balance point around these levels. We will test the R1 $0.23 usd area, after which a correction will occur. The evolution of the XRP / USD price over the next two days will also depend on the BTC move.
It remains to be seen if the correction wave that follows will go below $0.185 usd or will stabilize above S1 $0.19 usd
Any positive news about Ripple, or negative movements of the Bitcoin price, may positively or negatively influence this technical analysis.


Bitcoin’s Value Climbs Above $71,000 Ahead of Impending Halving Event

Best Bitcoin Miners in 2024

BlockDAG’s Visionary Leap: Sparking a Crypto Revolution with 5000% ROI Potential

Earn Passive Income Quickly with ARKMining Cloud Mining – Daily Profits

Bitcoin Boom vs China’s Ban: Investors Caught in Crossfire

BlockDAG’s Visionary Leap: Sparking a Crypto Revolution with 5000% ROI Potential
BlockDAG’s groundbreaking announcement has stirred a wave of excitement in the cryptocurrency community, following its keynote presentation broadcasted across the...

Earn Passive Income Quickly with ARKMining Cloud Mining – Daily Profits
ARKMining, a leading cloud mining platform, recently released a complete analysis report demonstrating its potential to help individuals easily earn...

Top Crypto Altcoins of 2024: SHIB, MK, and BDAG – Unlock Your Path to Growth and Profit
The best crypto altcoins of 2024, according to top crypto analysts are Shiba Inu (SHIB), Meme Kombat (MK), and BlockDAG...

Insiders Reveal: BlockDAG’s Presale Poised for 50X Boom with Possible Bitcoin Breakout on the Way; BTCMTX Presale Set to End
The Bitcoin rally may still have room for further growth following a recent breakout. However, increased Bitcoin volatility could occur,...


Wizarbit – Quick Bitcoin Purchase with Credit Card
In the fast-paced world of cryptocurrency, convenience and speed are paramount. Wizarbit emerges as a trailblazer in facilitating swift Bitcoin...
