Technical Analysis
Technical analysis XRP/USD 12/09/2017

At hour (h 0) when I write this technical analysis, the XRP/USD price just broke the descending trend line. Traded volumes are small. On the graph we see that a pattern head and shoulders (inversal) has been formed or, as it is called, the head and shoulders bottom. This is a bull pattern. It remains to be seen if the price manages to keep above the descending trend line and if the head and shoulders pattern is confirmed. The $0.19-$0.20 usd area seems quite interesting. The price was rejected up four times from that area.
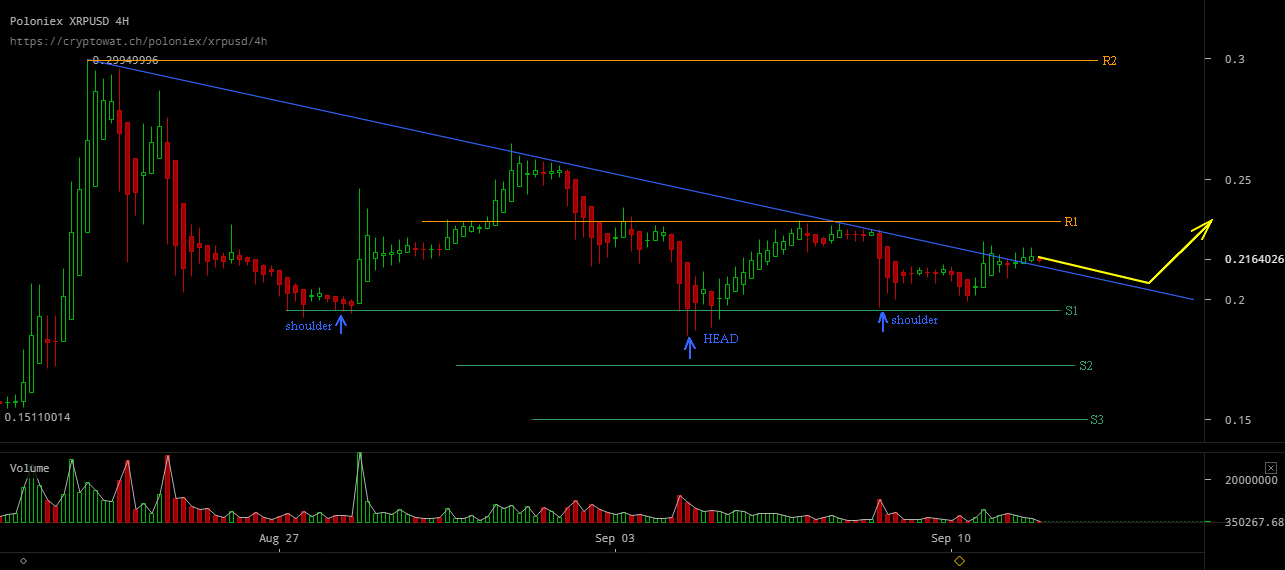
The resistance lines are: The support lines are:
R1 – $ 0,23usd S1 – $0,19usd
R2 – $0.30usd S2 – $0,175usd
S3 – $0,15usd
I would ask you to take attention to the BTC movement because it can greatly influence the XRP/USD movement. At this moment, on the BTC we have a descending triangle pattern (bear). The support from the $3900 usd on the BTC could be tested again. The tendency for the next two days is drawn in yellow. If BTC breaks the support from 3900usd, the upward trend of XRP / USD will be denied.


Bitcoin’s Value Climbs Above $71,000 Ahead of Impending Halving Event

Best Bitcoin Miners in 2024

BlockDAG’s Visionary Leap: Sparking a Crypto Revolution with 5000% ROI Potential

Earn Passive Income Quickly with ARKMining Cloud Mining – Daily Profits

Bitcoin Boom vs China’s Ban: Investors Caught in Crossfire

BlockDAG’s Visionary Leap: Sparking a Crypto Revolution with 5000% ROI Potential
BlockDAG’s groundbreaking announcement has stirred a wave of excitement in the cryptocurrency community, following its keynote presentation broadcasted across the...

Earn Passive Income Quickly with ARKMining Cloud Mining – Daily Profits
ARKMining, a leading cloud mining platform, recently released a complete analysis report demonstrating its potential to help individuals easily earn...

Top Crypto Altcoins of 2024: SHIB, MK, and BDAG – Unlock Your Path to Growth and Profit
The best crypto altcoins of 2024, according to top crypto analysts are Shiba Inu (SHIB), Meme Kombat (MK), and BlockDAG...

Insiders Reveal: BlockDAG’s Presale Poised for 50X Boom with Possible Bitcoin Breakout on the Way; BTCMTX Presale Set to End
The Bitcoin rally may still have room for further growth following a recent breakout. However, increased Bitcoin volatility could occur,...


Wizarbit – Quick Bitcoin Purchase with Credit Card
In the fast-paced world of cryptocurrency, convenience and speed are paramount. Wizarbit emerges as a trailblazer in facilitating swift Bitcoin...
