Technical Analysis
Technical Analysis XRP/USD 17/11/2017

Today, in order to have an overview of price movements on XRP/USD, I choose a technical analysis on the daily chart.
Here’s how the predicted to move in the latest technical analysis has been confirmed once again. I was say then that we will have a downward movement with a minimum of 0.19 or 0.17 USD due to the Bitcoin fall, followed by a recovery move until 0.23 USD. Yesterday the upward movement was much more aggressive than we anticipated. On the background of news (AMEX will become a partner with Ripple in cross-border payments), the price reached 0.283 USD. Subsequently, a strong correction took place up to 0.225 USD.
As you can see on the graph, we have the highest and the highest that have formed an ascending trend line. This means that at some point there will be a trend up, which will exceed the previous maxims. It is also for the third time when the price tests the area of 0.28-0.30 USD. Every touch of that area weakens the resistance. In technical analysis, it is known that a resistance zone can not resist infinitely. The technical analysis tells us that this wave up (if it continues) or the fourth wave up will break up the resistance from 0.30.
The resistance lines are: The support lines are:
R1 – 0,23usd S1 – 0,20usd
R2 – 0,30usd S2 – 0,175usd
S3 – 0,15usd
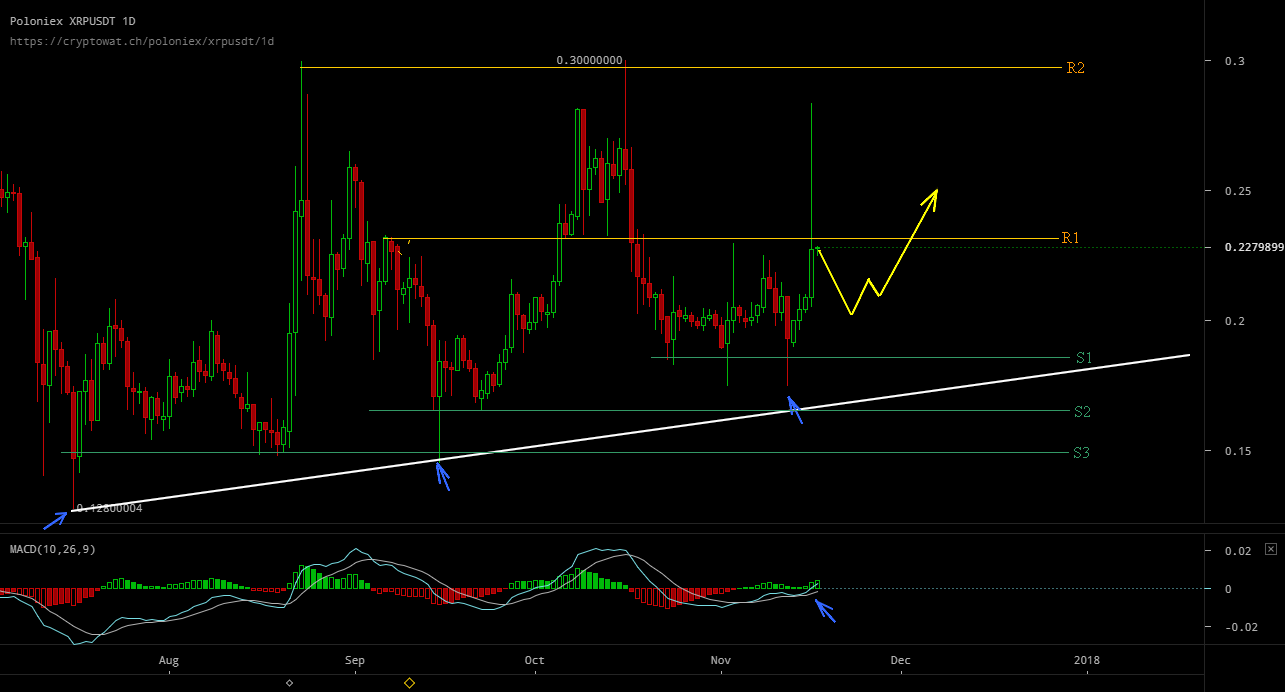
It is for the third time when short-term speculators or swing traders have earned profits by buying 0.15 – 0.17 – 0.19 USD in support areas. Later they sold in the resistance area of 0.28 – 0.30 USD. Further, buying in support areas can deliver very good returns in the future. For who has some experience in Crypto Market, the XRP/USD parity has had predictable moves that made money easy.
What can we expect in the next few days?
The price will continue to descend and will probably test the S1 support 0.20 USD. Subsequently, the price will have a lateral consolidation move or a recovery to the resistance area R1 0.23 USD.
The MACD tool is in the green area and soon it will cross line 0. More precisely, the MACD tool tells us that we are on a rising trend and soon the upward movement will be even stronger, going over line 0.
The probable direction for the next few days is drawn in yellow on the chart.


Bitcoin’s Value Climbs Above $71,000 Ahead of Impending Halving Event

Best Bitcoin Miners in 2024

BlockDAG’s Visionary Leap: Sparking a Crypto Revolution with 5000% ROI Potential

Earn Passive Income Quickly with ARKMining Cloud Mining – Daily Profits

Bitcoin Boom vs China’s Ban: Investors Caught in Crossfire

BlockDAG’s Visionary Leap: Sparking a Crypto Revolution with 5000% ROI Potential
BlockDAG’s groundbreaking announcement has stirred a wave of excitement in the cryptocurrency community, following its keynote presentation broadcasted across the...

Earn Passive Income Quickly with ARKMining Cloud Mining – Daily Profits
ARKMining, a leading cloud mining platform, recently released a complete analysis report demonstrating its potential to help individuals easily earn...


Top Crypto Altcoins of 2024: SHIB, MK, and BDAG – Unlock Your Path to Growth and Profit
The best crypto altcoins of 2024, according to top crypto analysts are Shiba Inu (SHIB), Meme Kombat (MK), and BlockDAG...


Insiders Reveal: BlockDAG’s Presale Poised for 50X Boom with Possible Bitcoin Breakout on the Way; BTCMTX Presale Set to End
The Bitcoin rally may still have room for further growth following a recent breakout. However, increased Bitcoin volatility could occur,...


Wizarbit – Quick Bitcoin Purchase with Credit Card
In the fast-paced world of cryptocurrency, convenience and speed are paramount. Wizarbit emerges as a trailblazer in facilitating swift Bitcoin...

Homtom Canada
November 25, 2017 at 9:20 am
Great information. I’m accumulating and I appreciated any information to reinforce my confidence in XRP. Thanks!