Technical Analysis
Technical Analysis XRP/USD 21/09/2017

As we have been accustomed to lately, to look closely at XRP/USD, we need to look at a Bitcoin chart. We notice that BTC has recovered very much in the last few days, rising to $4100 usd. At this point, BTC seems to strengthen its position. BTC was just below the downward trend line. In order to get rid of the bear trend, the BTC price has to break up the descending trend line. We will see if the BTC will be able to climb the next few days, or we will witness a longer slowdown followed by a consolidation period.
The resistance lines are: The support lines are:
R1 – $0,19usd S1 – $0,15usd
R2 – $0.23usd S2 – $0,128usd
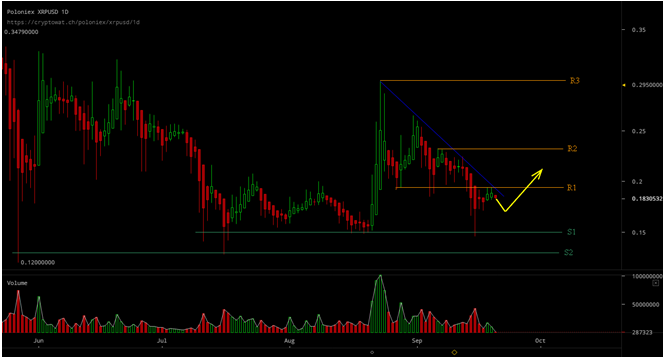
XRP/USD, as I said in the previous technical analysis, failed to break the resistance S1 $0.19usd and the descending trend line. And in the coming days the XRP/USD move will follow the BTC move. If BTC break up downward trend line, XRP/USD will break up resistance area S1 $0.19 USD, and will climb to S2 $0.23 USD. It should also be noted that the volumes traded on XRP/USD have been quite low over the past two days, meaning that large investors are not currently present on the market.
For the next two days, the possible evolution of the XRP/USD price is drawn in yellow on the chart.


Bitcoin’s Value Climbs Above $71,000 Ahead of Impending Halving Event

Best Bitcoin Miners in 2024

BlockDAG’s Visionary Leap: Sparking a Crypto Revolution with 5000% ROI Potential

Earn Passive Income Quickly with ARKMining Cloud Mining – Daily Profits

Bitcoin Boom vs China’s Ban: Investors Caught in Crossfire

BlockDAG’s Visionary Leap: Sparking a Crypto Revolution with 5000% ROI Potential
BlockDAG’s groundbreaking announcement has stirred a wave of excitement in the cryptocurrency community, following its keynote presentation broadcasted across the...

Earn Passive Income Quickly with ARKMining Cloud Mining – Daily Profits
ARKMining, a leading cloud mining platform, recently released a complete analysis report demonstrating its potential to help individuals easily earn...

Top Crypto Altcoins of 2024: SHIB, MK, and BDAG – Unlock Your Path to Growth and Profit
The best crypto altcoins of 2024, according to top crypto analysts are Shiba Inu (SHIB), Meme Kombat (MK), and BlockDAG...

Insiders Reveal: BlockDAG’s Presale Poised for 50X Boom with Possible Bitcoin Breakout on the Way; BTCMTX Presale Set to End
The Bitcoin rally may still have room for further growth following a recent breakout. However, increased Bitcoin volatility could occur,...


Wizarbit – Quick Bitcoin Purchase with Credit Card
In the fast-paced world of cryptocurrency, convenience and speed are paramount. Wizarbit emerges as a trailblazer in facilitating swift Bitcoin...
