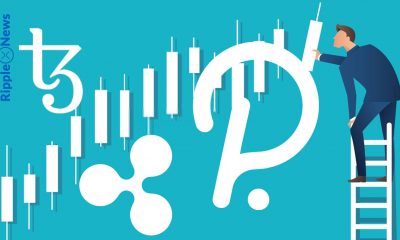
Technical Analysis
Technical Analysis XRP/USD 22/11/2017
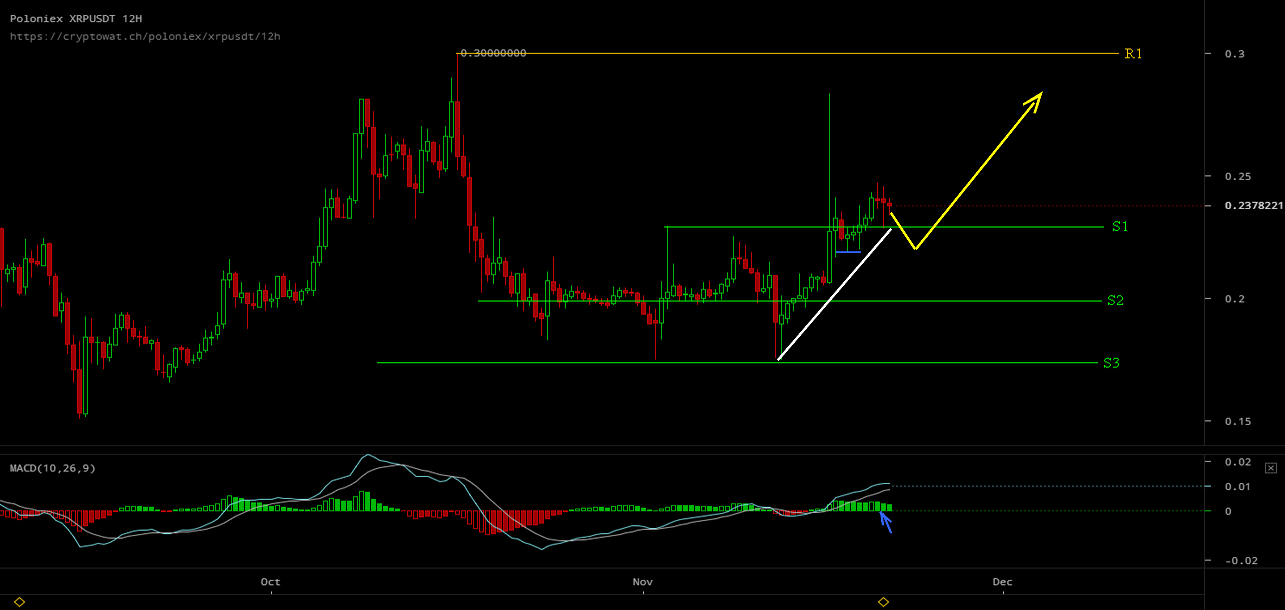
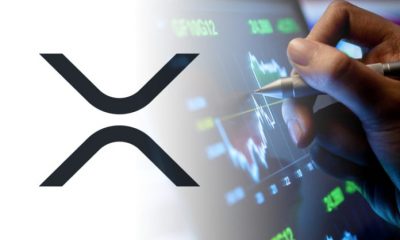
In the latest technical analysis after the announcement with AMEX, I was say that I expect a correction of up to 0.20 USD on XRP/USD and then a move up that will test R1 0.23 USD. Here’s how XRP/USD moved much more positively than I expected. The corrective wave did not fall below 0.218 USD, followed by a steady upward trend. The price broke the resistance line at 0.23 USD and went up to 0.247 USD.
I would add that the upward movement of the last days was an easy but determined move. Though the volumes traded are not high, it is a rising healthy trend, not a pump and dump move.
What are the causes of this healthy trend (drawn with white on the chart), which started after the last bottom of 0.175 USD? Many voices say XRP/USD is pulled up all over the market. I do not believe this story because we know very well that XRP/USD has an independent move many times.
After upward and downward movement due to the news with AMEX, many people expected a fall of 0.19-0.20 USD. This is not what happened, and as the price began to rise, the impatience began to appear in the minds of the buyers. It’s not about FOMO, it’s a little anxious. Being impatient not to have XRP in the portfolio. Buyers went after sellers’ prices. This explains the easy but determined move in the last few days.
The resistance lines are: The support lines are:
R1 – 0,30usd S1 – 0,23usd
S2 – 0,20usd
S3 – 0,175usd
What can we expect in the next few days?
At this point we have a corrective wave in progress. Even though the support line S1 0.23 USD is broken, I expect the corrective wave not to go down to S2 0.20 USD. The price I think will stop in the area that stopped from falling and the last time, exactly 0.218 USD. After this correction, upward movement to R1 0.30 USD will continue. The first price target of 0.28 USD. The MACD tool (chart 12 hours) is in the positive area (over 0) and is green. Signal lines indicate a continuation of the up trend. The probable direction for the next few days is drawn in yellow on the chart.
In closing the technical analysis, I would also like to say a few essential things about breaking the main resistance from 0.30 USD at the time of Escrow blocking announcement.
1. If the Escrow blocking announcement finds the price in the 0.27-0.30 range, we will have much more chances to break the main resistance from 0.30 USD.
2. It will be very important to buy in this area, but also how many speculators and weak hands are willing to sell at 0.30 USD.
3. Buy and hold institutional investors will buy XRP/USD? It is well known that this kind of institutional buyers is much better for trend health than institutional speculative funds.
These factors are very difficult to quantify.


Best Bitcoin Miners in 2024

BlockDAG’s Visionary Leap: Sparking a Crypto Revolution with 5000% ROI Potential

Earn Passive Income Quickly with ARKMining Cloud Mining – Daily Profits

Bitcoin Boom vs China’s Ban: Investors Caught in Crossfire

Top Crypto Altcoins of 2024: SHIB, MK, and BDAG – Unlock Your Path to Growth and Profit

BlockDAG’s Visionary Leap: Sparking a Crypto Revolution with 5000% ROI Potential
BlockDAG’s groundbreaking announcement has stirred a wave of excitement in the cryptocurrency community, following its keynote presentation broadcasted across the...

Earn Passive Income Quickly with ARKMining Cloud Mining – Daily Profits
ARKMining, a leading cloud mining platform, recently released a complete analysis report demonstrating its potential to help individuals easily earn...
Top Crypto Altcoins of 2024: SHIB, MK, and BDAG – Unlock Your Path to Growth and Profit
The best crypto altcoins of 2024, according to top crypto analysts are Shiba Inu (SHIB), Meme Kombat (MK), and BlockDAG...

Insiders Reveal: BlockDAG’s Presale Poised for 50X Boom with Possible Bitcoin Breakout on the Way; BTCMTX Presale Set to End
The Bitcoin rally may still have room for further growth following a recent breakout. However, increased Bitcoin volatility could occur,...


Wizarbit – Quick Bitcoin Purchase with Credit Card
In the fast-paced world of cryptocurrency, convenience and speed are paramount. Wizarbit emerges as a trailblazer in facilitating swift Bitcoin...
