Technical Analysis
Technical Analysis XRP/USD 28/09/2017

At the time I write the technical analysis, XRP/USD broke the resistance area R1 0.19usd and climbed to the resistance area R2 0.23usd. This upward move was predicted in the latest technical analysis. On the graph you can see that the price had broken the descending trend line (blue), one day ago. This upward movement of the XRP/USD parity is due to the upward movement of Bitcoin. Bitcoin broke the downward trend line and the bear trend is currently being denied. This fact has positively influenced the entire Crypto Market.
The resistance lines are: The support lines are:
R1 – 0,23usd S1 – 0,19usd
R2 – 0.30usd S2 – 0,17usd
S3 – 0,15usd
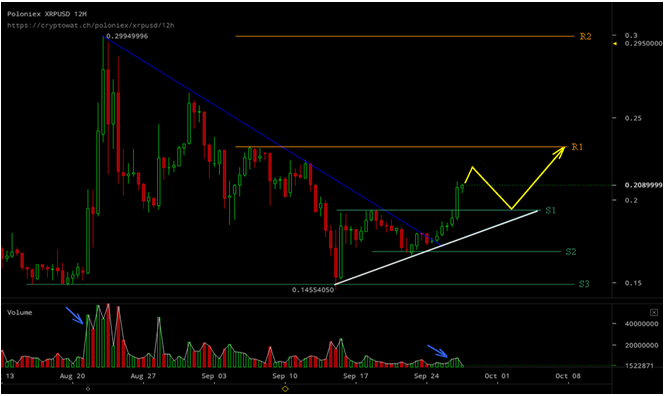
What surprised me is that this increase in XRP/USD was made with small volume traded. For comparison, look at the blue arrows at the bottom of the chart. However, it is a positive thing, because this growth seems much healthier than the pump and dump move up to 0.30usd in August.
Depending on the optimism on the market, the resistance zone R1 0.23usd can be reached or not. Whether the XRP/USD price will climb up to 0.23usd, in the coming days I expect a correction on XRP/USD. But I expect the corrective wave that will develop to stop at S1 0.19usd, or worst case line trend (ascending), drawn in white.
For the next two days, the possible evolution of the XRP/USD price is drawn in yellow on the chart.
Any positive news about Ripple, or negative movements of the Bitcoin price, may positively or negatively affect this technical analysis.


Bitcoin’s Value Climbs Above $71,000 Ahead of Impending Halving Event

Best Bitcoin Miners in 2024

BlockDAG’s Visionary Leap: Sparking a Crypto Revolution with 5000% ROI Potential

Earn Passive Income Quickly with ARKMining Cloud Mining – Daily Profits

Bitcoin Boom vs China’s Ban: Investors Caught in Crossfire

BlockDAG’s Visionary Leap: Sparking a Crypto Revolution with 5000% ROI Potential
BlockDAG’s groundbreaking announcement has stirred a wave of excitement in the cryptocurrency community, following its keynote presentation broadcasted across the...

Earn Passive Income Quickly with ARKMining Cloud Mining – Daily Profits
ARKMining, a leading cloud mining platform, recently released a complete analysis report demonstrating its potential to help individuals easily earn...


Top Crypto Altcoins of 2024: SHIB, MK, and BDAG – Unlock Your Path to Growth and Profit
The best crypto altcoins of 2024, according to top crypto analysts are Shiba Inu (SHIB), Meme Kombat (MK), and BlockDAG...


Insiders Reveal: BlockDAG’s Presale Poised for 50X Boom with Possible Bitcoin Breakout on the Way; BTCMTX Presale Set to End
The Bitcoin rally may still have room for further growth following a recent breakout. However, increased Bitcoin volatility could occur,...


Wizarbit – Quick Bitcoin Purchase with Credit Card
In the fast-paced world of cryptocurrency, convenience and speed are paramount. Wizarbit emerges as a trailblazer in facilitating swift Bitcoin...

Mohsen
September 30, 2017 at 6:05 pm
Hey thanks for sharing your analysis .
Can you elaborate where is the price on the 1 and 2 and 3 of okt in the chart?
Best mohsen
ahmadderar
September 30, 2017 at 10:00 pm
the prices at S1, S2, S3 are clearly mentioned above the image. Where are written, “support areas” are also given the prices