Technical Analysis
Technical Analysis XRP/USD 31/10/2017
Today when I opened the XRP/USD chart I was surprised. The first time I thought there was an attack on the site. Looks like it was, just a Halloween joke. Be careful! XRP/USD is tracked by ghosts. 😉
Here’s how the downward movement of XRP/USD has stopped. We have a new maximum that exceeds the previous maximum. After the price reached 0.217 USD, the corrective wave that followed did not drop below the last minimum (0.183 USD). In the technical analysis this means that 0.183 USD could represent the bottom. The price could re-start the trend up to 0.30 USD. We will follow the trends in the coming days and see if my assumption was correct. The volumes traded in recent days were very low.
The resistance lines are: The support lines are:
R1 – 0,23usd S1 – 0,19usd
R2 – 0,30usd S2 – 0,17usd
S3 – 0,15usd
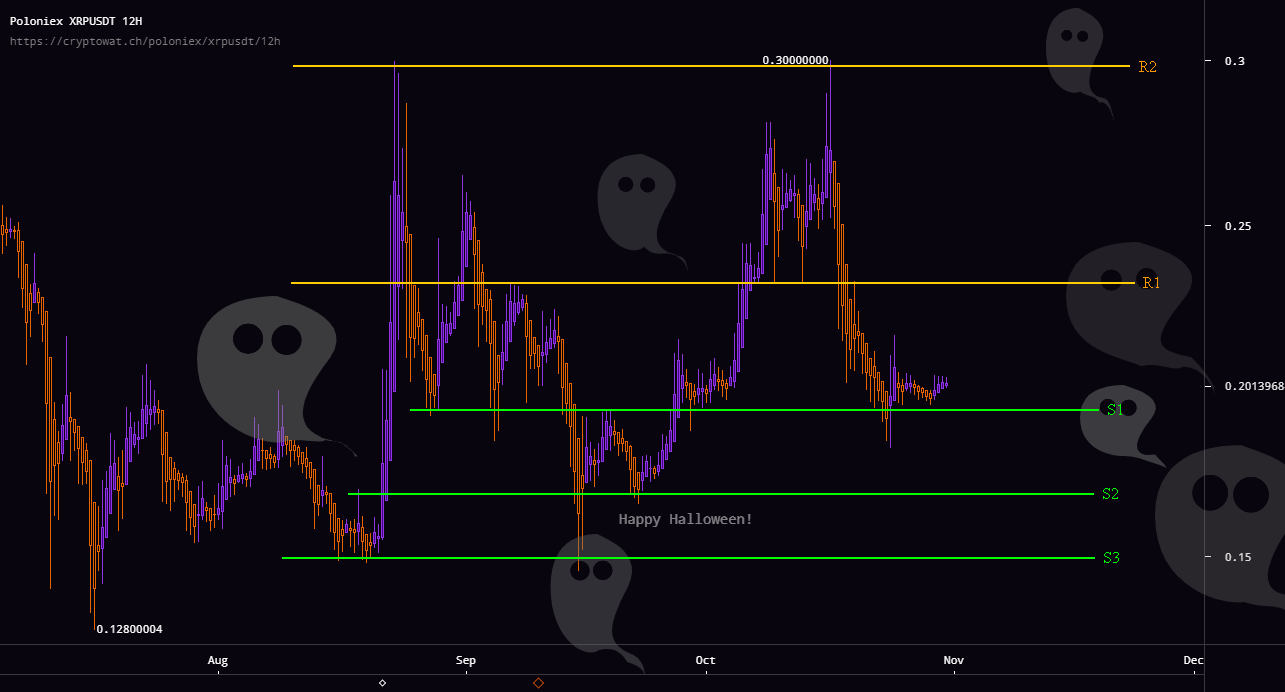
This is the first time I can not foresee with certainty the likely direction for the next three days. The price movement of these days on XRP/USD seems to be a consolidation move, but … the price could move down in a head and shoulder pattern, or it could go up . If XRP/USD does not fall below the last minimum of 0.183 USD, we will climb to R1 by 0.23 USD passing through 0.217 USD.
The technical analysis also has such moments of uncertainty that the chart does not give you a clear indication of future direction. That is, do not buy XRP/USD of all the money. Still holding something fiat, if XRP/USD could have cheaper prices in the next three weeks.


Bitcoin’s Value Climbs Above $71,000 Ahead of Impending Halving Event

Best Bitcoin Miners in 2024

BlockDAG’s Visionary Leap: Sparking a Crypto Revolution with 5000% ROI Potential

Earn Passive Income Quickly with ARKMining Cloud Mining – Daily Profits

Bitcoin Boom vs China’s Ban: Investors Caught in Crossfire

BlockDAG’s Visionary Leap: Sparking a Crypto Revolution with 5000% ROI Potential
BlockDAG’s groundbreaking announcement has stirred a wave of excitement in the cryptocurrency community, following its keynote presentation broadcasted across the...

Earn Passive Income Quickly with ARKMining Cloud Mining – Daily Profits
ARKMining, a leading cloud mining platform, recently released a complete analysis report demonstrating its potential to help individuals easily earn...


Top Crypto Altcoins of 2024: SHIB, MK, and BDAG – Unlock Your Path to Growth and Profit
The best crypto altcoins of 2024, according to top crypto analysts are Shiba Inu (SHIB), Meme Kombat (MK), and BlockDAG...

Insiders Reveal: BlockDAG’s Presale Poised for 50X Boom with Possible Bitcoin Breakout on the Way; BTCMTX Presale Set to End
The Bitcoin rally may still have room for further growth following a recent breakout. However, increased Bitcoin volatility could occur,...


Wizarbit – Quick Bitcoin Purchase with Credit Card
In the fast-paced world of cryptocurrency, convenience and speed are paramount. Wizarbit emerges as a trailblazer in facilitating swift Bitcoin...

Sahil Gupta
October 31, 2017 at 11:33 pm
Ripple showed good movement in May 2017 as well as some fluctuation recently. To all my surprise why is it increasing in such a drastic fashion and not slow and steady as you can see in May 2017 graph. Can you please explain so that if its a good venture I can invest in it.
mihaisyblu
November 1, 2017 at 9:31 am
This move in the range between 0.15us and 0.30usd is due to the fact that XRP / USD is now highly speculated by whales. Specifically, short-term profits amid well-timed events (SWELL). And short-term traders have their contribution to this up-down move. This speculative move can not last indefinitely. At one point, when they buy buyers and institutions willing to hold coins for years, XRP will have a steady upward trend.
Ripple and XRP is one of the most underestimated coins at this time and its technology is being tested by over 100 banks. Cuallix is the first bank to use XRapid and XRP in cross-border payments. To get an idea about Ripple and XRP, please read the latest article on this topic.
https://www.ripplecoinnews.com/now-ripple-technology-and-xrp-are-closely-linked
My advice is to look for a cheaper entry price (0.17-0.15usd) and hold between 1 and 5 years. Please do your own research regarding Ripple and XRP. If you think it is a technology of the future and you think it has great prospects, invest.